
Reported Road Casualties in Great Britain During 2016
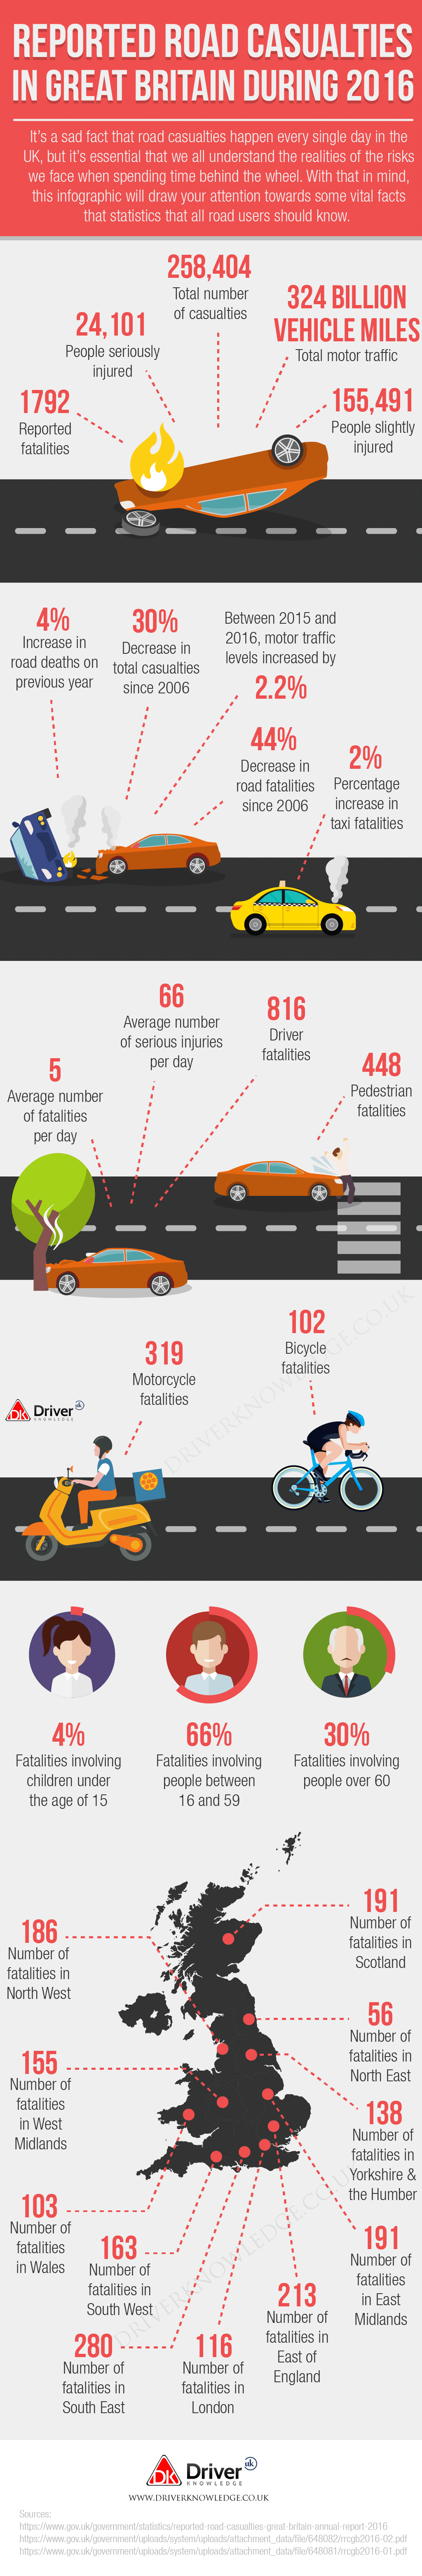
It’s a sad fact that road casualties happen every single day in the UK, but it’s essential that we all understand the realities of the risks we face when spending time behind the wheel. With that in mind, this infographic will draw your attention towards some vital facts that statistics that all road users should know.
Summary
1792 Reported fatalities
24,101 People seriously injured
155,491 People slightly injured
258,404 Total number of casualties
324 billion vehicle miles Total motor traffic
Increase or Decrease
4% Increase in road deaths on the previous year
30% Decrease in total casualties since 2006
2.2% Between 2015 and 2016, motor traffic levels increased by
44% Decrease in road fatalities since 2006
2% Percentage increase in taxi fatalities
Average Per Day
5 Average number of fatalities per day
66 Average number of serious injuries per day
Fatalities by Road Use Type
816 Driver fatalities
448 Pedestrian fatalities
319 Motorcycle fatalities
102 Bicycle fatalities
Fatalities by Age
4% Fatalities involving children under the age of 15
66% Fatalities involving people between 16 and 59
30% Fatalities involving people over 60
Fatalities by Region
186 Number of fatalities in North West
155 Number of fatalities in West Midlands
103 Number of fatalities in Wales
163 Number of fatalities in South West
280 Number of fatalities in South East
116 Number of fatalities in London
213 Number of fatalities in East of England
191 Number of fatalities in East Midlands
138 Number of fatalities in Yorkshire & the Humber
191 Number of fatalities in Scotland
56 Number of fatalities in North East
Sources:
https://www.gov.uk/government/statistics/reported-road-casualties-great-britain-annual-report-2016
https://www.gov.uk/government/uploads/system/uploads/attachment_data/file/648082/rrcgb2016-02.pdf
https://www.gov.uk/government/uploads/system/uploads/attachment_data/file/648081/rrcgb2016-01.pdf
More Readings:
https://www.driverknowledge.co.uk/what-to-do-after-a-car-accident/
https://www.driverknowledge.co.uk/keep-safe-when-driving-at-night/
https://www.driverknowledge.co.uk/driving-test-theory/